Introduction
The Cost Estimator is an online tool that estimates the real-time health impact and economic cost from fine particulate matter (PM2.5) air pollution in major world cities.1It is deployed in a collaboration between Greenpeace Southeast Asia, IQAir and the Centre for Research on Energy and Clean Air (CREA). Estimates of real time health and economic costs can be viewed on the Cost Estimator website.2
Methodology & input data
The Cost Estimator is based on methodology used for the Greenpeace Southeast Asia & CREA 2020 Toxic Air report, which estimated the global health impact and economic cost resulting from exposure to fossil fuel air pollution.3 The Cost Estimator uses real-time ground-level PM2.5 measurements collated in IQAir’s database.4 The algorithm applies scientific risk models in combination with population and public health data to estimate the health and economic costs of air pollution exposure. Mortality and cost estimates represent the total impact attributable to PM2.5.
Accuracy
The Cost Estimator results represent a useful estimate of the real world cost based on currently available scientific knowledge. Like all research, the data and method used by the Cost Estimator contain uncertainty. This uncertainty relates to the precision and representativeness of pollution measurement data, demographic and epidemiological data and information about the economic cost of health impacts. Scientific understanding of the relation between exposure to air pollution and the associated risks for health is an active area of research; the latest available knowledge has been used. In case of missing data, conservative assumptions have been adopted, such that there is an inbuilt tendency towards underestimation of the cost of air pollution. Specifically the Cost Estimator accounts only for the impact of PM2.5, and not for other air pollutants which are also known to have negative health impacts.
Step by step methodology
1) Air Pollution Data
Sensor types
The Cost Estimator uses measurements of PM2.5from ground-based outdoor pollution monitors in cities around the world. The devices are deployed and operated by governments, organizations such as PurpleAir, and private individuals. The data is sourced and aggregated continuously by IQAir.5
City-wide value
Most cities have several monitors, but the Cost Estimator uses one air pollution value for the entire city. Where there are multiple monitors within a city, their median value is used. Pollution is recorded hourly. The interval for computing 24-hour averages starts at 0:00 UTC in all cities around the world.
Quality controls
Monitors with non-governmental operators undergo quality checks by IQAir before being incorporated into the database. The operator demonstrates by photo submission that the sensor is in a suitable location, which means outdoors and sheltered from precipitation, wind and direct sunlight. In addition, IQAir continuously checks that the carbon-dioxide (CO2) concentration, humidity and temperature readings reflect outdoor conditions during operation.
IQAir performs quality assurance checks on the aggregated data, for example by removing outlying data points when compared with neighbouring monitoring stations. The measurements for each monitoring station are grouped according to the city in which they are located.
Indirect PM2.5 data
Some monitors only measure coarse particulate matter (PM10) and do not measure PM2.5. For these monitors, the PM2.5 values are derived from the PM10 measurement using a machine learning system. This system introduced an additional uncertainty; therefore only those cities where the share of native PM2.5 monitors is greater than 90% are included.
Representativeness / city filtering
It is assumed by the Cost Estimator that the median of annual mean PM2.5 concentrations measured by ground level monitoring sites is representative of exposure in each city. However, cities are heterogeneous and this assumption introduces a significant uncertainty. Monitors in each city were assessed to identify obvious bias that could lead to overestimation of PM2.5 exposure. The station locations were overlaid on satellite imagery and manually checked through visual inspection, including the use of street level photography where available. Cities are only included where (a) the monitors show a reasonable geographic spread across the metropolitan area (no clustering, even distribution
Data completeness
Real-world air pollution datasets are rarely complete. Outages during maintenance and technical faults result in missing data. On days without pollution measurement for a city, the previous day’s measurement is used as a best guess. Only cities with >75% data availability over the year are included.
Other pollutants
Besides PM2.5, there are other pollutants which are known to cause damage to human health, such as nitrogen dioxide (NO2), ozone (O3) and sulfur-dioxide (SO2). Although many of the cities included in the Cost Estimator also have monitors for these pollutants, data availability is generally much poorer. Furthermore, health impacts from NO2 are not included in our results because NO2 has a high spatial variability and thus the data from point measurements are less representative for the whole city.
2) Demographic and Epidemiological Data
To assess the health impacts, the Cost Estimator uses population and epidemiological data for the metropolitan area of each city. The Cost Estimator assumes that the measured pollutant concentrations aggregated by IQAir provide a reasonable representation of pollution exposure across the metropolitan area of each city (see previous section). Population numbers for most world cities are taken from the United Nations World Population Prospects 2019,6 except for Taiwanese cities (Dept. of Household Registration, Ministry of the Interior, Taiwan7), Nairobi (Kenya Bureau of Statistics8), Delhi and Patna (India Population 20209 and India Population 201910) and Turkish cities (Turkish Statistical Institute11).
The data sources of the cities’ incidence rates of each health impact as well as the risk functions used to compute the fraction of the health impacts that is attributable to air pollution are listed in Table 1.
Table 2. Relative risk at a 10 µg/m3increase in concentration for various health impacts and data source of the incidence rates.12,13,14,15,16,17,18,19,20,21,22
| Health impact | Pollutant | Metric | Relative risk r(x-x0=10 µg/m3) | Detection threshold x0(µg/m3) | Relative Risk Source | Incidence Rate Source23 |
| Child asthma emergency room visits24 | PM2.5 | Annual mean | 1.025 | 6 | Zheng et al. 2015 | Anenberg et al 2018 |
| Adult asthma emergency room visits25 | PM2.5 | Annual mean | 1.023 | 6 | Zheng et al. 2015 | Anenberg et al 2018 |
| Preterm births | PM2.5 | Annual mean | 1.15 | 8.8 | Trasande et al 2016 | Chawanpaiboon et al 2019 |
| Days of work absence | PM2.5 | Annual mean | 1.039 | 0 | WHO HRAPIE 2013 | EEA 2014 |
| Adult deaths, years of life lost and years of life with disability | PM2.5 | Annual mean | non-linear | 2.4 | Burnett et al26 | GBD 2017 |
3) Health Impact Assessment
The Cost Estimator links specific health impacts to air pollution using scientific risk models from the literature for each impact. The health impacts listed in Table 1 are included in the estimator.
The calculation applies concentration-response functions to the pollutant concentrations of PM2.5to determine the portion of the city’s incidence/prevalence rates of different health impacts caused by air pollution. A concentration-response function relates a pollutant concentration to the impact of that pollutant on a population.
Deaths, years of life lost and years lived with disability due to PM2.5 exposure are calculated using non-linear, age-specific risk, which gives the increase in risk of different health effects as a function of pollutant concentration, compared with clean air (see Table 1 for references).
For these health impacts, the annual incidence m of a health impact in a specific city is related to the city’s population P, the cause-specific death rate in the country m0, the risk ratio r and the annual average pollutant concentration xa by
m = P . m0 . (1 / r(xa)),
where r(xa) is an empirical function (adopted from the literature). For most health impacts, r(xa) is modelled by a log-linear risk function, meaning that r increases in a multiplicative manner per incremental increase in pollutant concentration:
r(xa) = exp[c . (xa–x0)] if xa > x0r = 1 otherwise,
with c being an empirical constant (also called “concentration-response factor”) and x0the detection threshold (also called “no-risk threshold”, Table 1 and Figure 1), which is usually the lowest concentration found in the study population – it is based on absence of direct evidence, not evidence that there is no risk. Excluding impacts below this threshold is a very conservative assumption.
For presentation of real-time data on the Cost Estimator website these annual costs are then apportioned linearly to the period of the calendar year that has elapsed in proportion to the average pollutant concentrations of the year to date, such that time periods with higher pollution incur greater costs. The year-to-date incidence mdis calculated from the past-365-day incidence by
md = m . [(xd – x0) / (xa – x0)] . t / 365d if xa, xd > x0; 0 otherwise,
where xdis the year-to-date average pollutant concentration and t is the elapsed time in the current calendar year.
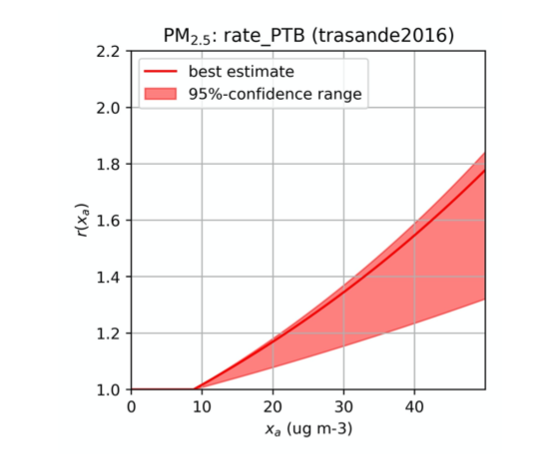
Figure 1: Relative risk function r(xa) for preterm births due to PM2.5 pollution (Trasande et al. 2016). Note the discontinuity of the central/best estimate at the detection threshold x0 = 8.8 μg/m3 as a result of the conservative assumption r(xa <x0) = 1.
Cost Assessment
Health impacts associated with air pollution exposure have economic consequences. Principal among these are direct health care costs, (for example the cost of asthma treatment,) and the cost of reduced economic productivity. Economic productivity may be reduced by absence from or reduced capacity for work.
In addition, a higher risk of death or disability affects people’s well-being; this welfare cost is measured in money by converting it to the amount that people are willing to pay in order to avoid the negative health outcome (“willingness-to-pay”).
These two different types of cost are included where possible and are combined to a total cost. The health impacts listed in Table 2 are included in the calculation as described below:
Lost life years
The economic losses from these air pollution-related deaths are assessed based on the resulting reduction in life expectancy, with one year of life lost equating to economic loss of EUR 56,000 (USD 67,000) in the European Union, following the EEA cost-benefit methodology27, and adjusted by Gross
Diabetes, asthma and other chronic respiratory diseases, and disabilities caused by stroke
The Global Burden of Disease project29 has quantified the degree of disability caused by each disease into a “disability weight” that can be used to compare the costs of different illnesses.
The economic cost of disability and reduced quality of life caused by diabetes and chronic bronchitis is assessed based on these disability weights, combined with the economic valuation of disability used by the UK environmental regulator DEFRA30. The valuation is adjusted by GNI PPP for other countries. For example, type 2 diabetes without complications has a disability weight of 4.9%, meaning that the cost of one year lived with diabetes is estimated at 4.9% of the cost of one year lived with disability, or USD 4,000 in the UK and USD 1,600 at world average income level.
The economic cost of asthma related to air pollution is assessed based on two indicators: new cases of asthma linked to NO2 exposure, and emergency room visits related to PM2.5 exposure. An assessment of the direct and indirect cost per year associated with childhood asthma, including medical costs and loss of income to the child’s caregiver, found a cost of USD 3,800 and USD 4,000 in two different communities in California, United States31. The midpoint of these two valuations is used for the estimates, adjusted by the ratio of California’s Gross Regional Product to the US national average, and by GNI PPP for other countries. The cost of an emergency room visit is taken from the same study.
Exposure to PM2.5is very likely linked to an even larger number of new asthma cases globally than exposure to NO2, but uncertainty in the estimates is large32, so this effect is not included. Instead, only the economic cost of emergency room visits for asthma linked to PM2.5 exposure are included. This is only a small part of the overall cost of the burden of asthma linked to PM2.5.
Preterm Birth and Low Birth Weight
PM2.5 exposure to pregnant women increases the likelihood of preterm birth and low birth weight, both of which in turn increase the risk of many health and development issues throughout a baby’s life. An estimated economic cost of a preterm birth, which primarily results from lower economic productivity and increased health care costs, of USD 300,000 per birth in the US is used.33 The valuations are adjusted using GDP PPP within regional groups.
Work Absence
Exposure to PM2.5 air pollution leads to increased work absences due to illness (sick leave). The incidence of work absences is estimated using WHO recommended concentration response functions34. The economic cost of sick leave is evaluated at USD 145 per day in the European Union, based on EEA recommendations35, and adjusted for other countries based on GDP PPP.
The method and data used are described in further in reports by CREA36 and Greenpeace Southeast Asia37.
Contributors and internal review
IQAir collected, city-aggregated, quality-checked, filtered and managed the measurement data of the on-site air pollution monitors.
CREA conceptualized the health impact assessment & economic cost computation and implemented it in computer code.
Greenpeace conducted a technical review of the methods and their implementation and analysed the resulting health impact and cost data set.
1 Myllyvirta, L. (2020) Revealing the Cost of Air Pollution in World’s Cities – in Real Time. July 2020. CREA. https://energyandcleanair.org/revealing-the-cost-of-air-pollution-in-real-time/
2 https://www.greenpeace.org/international/campaign/tracking-cost-air-pollution/
3 Farrow, A., Miller, K. A. & Myllyvirta, L. (2020) Toxic air: The price of fossil fuels. Seoul: Greenpeace Southeast Asia. February 2020. Greenpeace Research Laboratories Technical Report 02-2020: 44 pp
4 either from direct measurement or derived from PM10 measurement.
5IQAir. “2019 World Air Quality Report.” (2020). between centre, city domain and suburbs) and (b) less than 50% of the monitors are closer than 50 metres to major roads. These criteria provide a practical method for screening any city where monitor locations are very likely to cause an overestimation of PM2.5 concentration. As their application is necessarily subjective to some degree; this process was independently carried out by two different analysts.
6 United Nations, Department of Economic and Social Affairs, Population Division (2019). World Population Prospects 2019: Volume I: Comprehensive Tables.
7Dept. of Household Registration, Ministry of the Interior, Taiwan. (2020). https://gis.ris.gov.tw/dashboard.html
8 Kenya Bureau of Statistics (2019) 2019 Kenya Population and Housing Census Volume I: Population by County and Sub-County
9India Population of 2019. (2019) https://indiapopulation2019.com/population-of-patna-2019.html
10 India Population of 2020. (2020) https://indiapopulation2020.in/population-of-delhi-2020.html
11 Turkish Statistical Institute. (2020) https://www.tuik.gov.tr/
12 Zheng, Xue-yan, et al. (2015). Association between air pollutants and asthma emergency room visits and hospital admissions in time series studies: a systematic review and meta-analysis.” PloS one 10.9. https://doi.org/10.1371/journal.pone.0138146
13 Trasande L, et al. (2016). Particulate Matter Exposure and Preterm Birth: Estimates of U.S. Attributable Burden and Economic Costs. Environmental Health Perspectives 124:12. https://doi.org/10.1289/ehp.1510810
14 Dadvand P et al. (2013). Maternal Exposure to Particulate Air Pollution and Term Birth Weight: A Multi-Country Evaluation of Effect and Heterogeneity. Environmental Health Perspectives.
https://ehp.niehs.nih.gov/doi/full/10.1289/ehp.1205575?url_ver=Z39.88-2003&rfr_id=ori:rid:crossref.org&rfr_dat=cr_pub%3d pubmed
15 Malley CS, et al. (2017). Updated Global Estimates of Respiratory Mortality in Adults ≥30Years of Age Attributable to Long-Term Ozone Exposure. Environmental Health Perspectives 125:8 CID: 087021 https://doi.org/10.1289/EHP1390
16 World Health Organization. (2013) Health risks of air pollution in Europe—HRAPIE project recommendations for concentration–response functions for cost–benefit analysis of particulate matter, ozone and nitrogen dioxide. UN City: Copenhagen, Denmark
17 Achakulwisut, Pattanun, et al. (2019). Global, national, and urban burdens of paediatric asthma incidence attributable to ambient NO2 pollution: estimates from global datasets. The Lancet Planetary Health 3.4 (2019): e166-e178.
18 Anenberg, Susan C., et al. (2018). Estimates of the Global Burden of Ambient PM2.5, Ozone, and NO2 on Asthma Incidence and Emergency Room Visits. Environmental health perspectives 126.10: 107004. https://doi.org/10.1289/EHP3766
19 Chawanpaiboon S, et al. (2019) Global, regional, and national estimates of levels of preterm birth in 2014: a systematic review and modelling analysis. Lancet Glob Health 7(1):e37-e46. doi: 10.1016/S2214-109X(18)30451-0
20 World Bank
https://datahelpdesk.worldbank.org/knowledgebase/articles/906519-world-bank-country-and-lending-groups
21 GBD 2017 Mortality Collaborators. (2018). Global, regional, and national age-sex-specific mortality and life expectancy, 1950–2017: a systematic analysis for the Global Burden of Disease Study 2017. The Lancet. 392:1684-735.
22 European Environment Agency (EEA) (2014) Costs of air pollution from European industrial facilities 2008–2012 — an updated assessment. EEA Technical report No 20/2014.
https://www.eea.europa.eu/publications/costs-of-air-pollution-2008-2012
23 These national-level data sources are used when city-level data is not available. When data for a country is not included in the data, the median value for all countries is used.
24 x0from: Anenberg et al., Estimates of the Global Burden of Ambient PM2.5, Ozone, and NO2 on Asthma Incidence and Emergency Room Visits, Environmental Health Perspectives 126:10 CID: 107004 https://doi.org/10.1289/EHP3766
25 idem
26 Burnett R, et al. (2018) Global estimates of mortality associated with long-term exposure to outdoor fine particulate matter. Proceedings of the National Academy of Sciences, 115 (38) 9592-9597
27 European Environment Agency (EEA) (2014) Costs of air pollution from European industrial facilities 2008–2012 — an updated assessment. EEA Technical report No 20/2014.
https://www.eea.europa.eu/publications/costs-of-air-pollution-2008-2012
National Income (GNI) Purchasing Power Parity (PPP) by country or region, with an elasticity of 0.9 as recommended by Organisation for Economic Co-operation and Development (OECD)28.
28 OECD. (2016). The Economic Consequences of Outdoor Air Pollution, OECD Publishing, Paris.
http://dx.doi.org/10.1787/9789264257474-en
29 Cohen, A. J. et al. (2017). Estimates and 25-year trends of the global burden of disease attributable to ambient air pollution: an analysis of data from the Global Burden of Diseases Study 2015. Lancet 389, 1907–1918
30 Birchby D, et al. (2019). Air Quality damage cost update 2019. Report for Defra. AQ0650. Ricardo Energy & Environment, United Kingdom.
31 Brandt SJ, et al. (2012) Costs of childhood asthma due to traffic-related pollution in two California communities. European Respiratory Journal Aug 2012, 40 (2) 363-370
32 Anenberg, Susan C., et al. (2018) Estimates of the Global Burden of Ambient PM2.5, Ozone, and NO2 on Asthma Incidence and Emergency Room Visits. Environmental health perspectives 126.10: 107004. (2018).
33 Trasande L, et al (2016) Particulate Matter Exposure and Preterm Birth: Estimates of U.S. Attributable Burden and Economic Costs. Environmental Health Perspectives 124:12.
34 World Health Organization. (2013) Health risks of air pollution in Europe—HRAPIE project recommendations for concentration–response functions for cost–benefit analysis of particulate matter, ozone and nitrogen dioxide. UN City: Copenhagen, Denmark
35 Converted from EUR to USD. Source: European Environment Agency (EEA) (2014) Costs of air pollution from European industrial facilities 2008–2012 — an updated assessment. EEA Technical report No 20/2014.
https://www.eea.europa.eu/publications/costs-of-air-pollution-2008-2012
36 Myllyvirta, L. (2020) Revealing the Cost of Air Pollution in World’s Cities – in Real Time. July 2020. CREA. https://energyandcleanair.org/revealing-the-cost-of-air-pollution-in-real-time/
37 Farrow, A. et al (2020) Toxic air: The price of fossil fuels. Seoul: Greenpeace Southeast Asia. February 2020. Greenpeace Research Laboratories Technical Report 02-2020: 44 pp
End the air pollution crisis once and for all, because no-one should have to worry about what they breathe.
Get Involved