The average global temperature between March and May this year reached 1.5°C above midrange temperatures in the early 19th century. Global heating deniers claim the variation in temperature since the industrial revolution is not unusual for temperature fluctuations during the Holocene – the 11,700-year era since the last glaciation. They claim, therefore, that anthropogenic carbon emissions cannot be considered a major contribution to the heating of Earth’s oceans and atmosphere.

On May 15, this year, both the Scripps and NOAA labs at Mauna Loa Observatory in Hawaii reported concentrations over 415.6 parts per million (ppm) of carbon-dioxide, the seasonal peak and new modern record. Most of Earth’s landmass and land-plants are in the northern hemisphere, so northern summer plant growth absorbs a lot of carbon-dioxide (CO2), reducing the amount in Earth’s atmosphere. In the fall, as photosynthesis declines, CO2 increases in the atmosphere. In the spring, when northern snowpacks melt, microbes release CO2 contributing to the annual peak carbon-dioxide count each May. This cycle explains the up and down fluctuation in Earth’s steadily rising CO2 concentration.
Earth’s CO2 concentration last ranged above 400 ppm in the mid-Pliocene, 3 million years ago, when temperatures reached 3°C above pre-industrial temperatures, 10°C higher in the Arctic, and when the sea level stood about 20 meters higher. At that time, our primate ancestors developed a promising new technology: chipped stone cutting tools. The last time CO2 in Earth’s atmosphere remained consistently above 400 ppm, some 16 million years ago in the warm mid-Miocene, our ancestors were venturing from trees onto the emerging African savanna.
Reading a typical climate denial website will provide a plethora of doctored charts, logical fallacies, and mis-interpreted data. One prominent denier of human-driven global heating recently asked me to name one single difference between our current warming and the normal fluctuations during the Holocene. He claimed, “not even the IPPC can name one.” I gave him nine differences. Here they are:
Changes in Holocene climate due to Human carbon emissions:
1. Higher CO2 concentrations in the atmosphere
At the end of the last glacial period, 12,000 years ago, carbon-dioxide concentrations stood at about 240 ppm. As Earth’s glaciers melted, concentrations rose to 270 ppm and fluctuated up to around 280 ppm for 12 millennia, until the age of industrial hydrocarbon burning. During the last two centuries, atmospheric CO2 concentration has risen from about 280 ppm to the modern record of 415 ppm, a 48% increase.
This equates to an extra quadrillion molecules of CO2 per cubic centimetre of atmosphere. Every one of those molecules serves as a tiny heat engine. This scale of carbon-dioxide heat absorption in the atmosphere is unprecedented in the Holocene.
2. Rate of CO2 increase
Throughout the Holocene, atmospheric carbon-dioxide increased at about 0.003 ppm / year (40 ppm over 12,000 years). The peak rate in the early Holocene reached about 0.024 ppm / year (24 ppm over 1,000 years). After indsutrialisation, the rate grew, and by 2017, the rate exceeded 2 ppm/year and the World Meteorological Society reported, “The rate of increase of atmospheric carbon dioxide over the past 70 years is nearly 100 times larger than that at the end of the last ice age. … such abrupt changes in the atmospheric levels of CO2 have never before been seen.” Today, human activity is now adding almost 3 ppm of CO2 to the atmosphere annually, over 100-times faster than the steepest Holocene rate and 1000-times faster than the average Holocene rate.
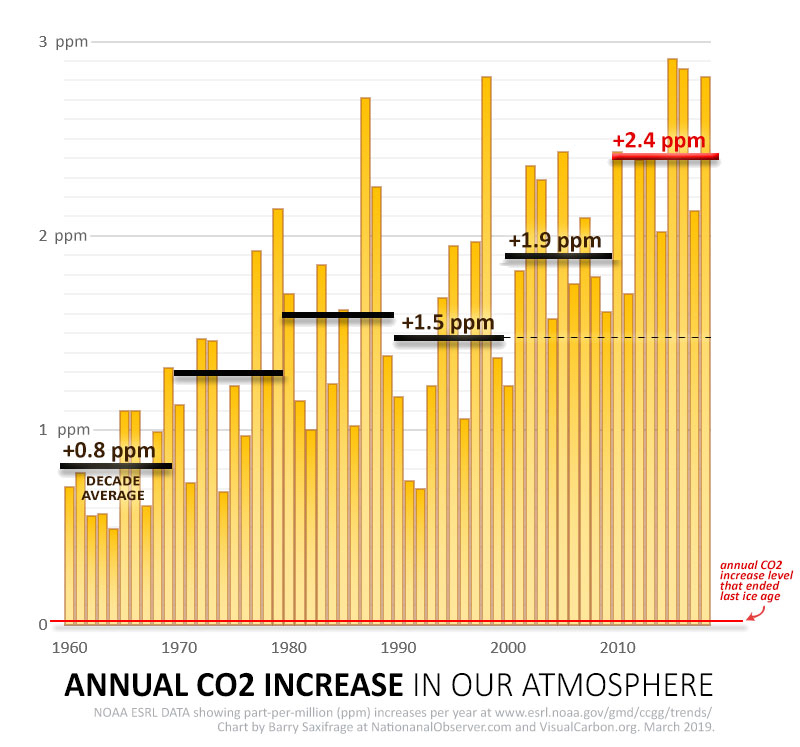
Annual and decade average rate of atmospheric CO2 increase, via Visual Carbon.
3. Heat energy inertia
Due to the speed of human carbon-dioxide increase, global temperature rise lags behind the carbon-dioxide concentrations. In meteorological science, this is called heat energy inertia. Global temperatures have risen by over 1°C since the industrial revolution, but we’ve added enough carbon already to take us to 2°C, and possibly higher with methane releases and other feedbacks. This is the heat energy inertia already in the global climate system. This too is unprecedented in the Holocene, and it is a big deal.
4. Breaking through the trend line
Human global heating denialists will conjure up charts that show a sweeping arc of high temperatures since the last ice age that dwarf the current rise in global temperature. However, the serious and rigorous scientific research shows that today’s temperature is higher than most or all of the Holocene, with the possible exception of some past temperature spikes. Furthermore, todays temperature increase has broken through the trend line of the Holocene. All fluctuating curves – climate, populations, stock markets – reveal a trend line, a running average of a variable indicating a general progression of change. Compared to Earth’s average 1961-1990 temperature, the Holocene temperature trend line shows a rise after the last glaciation, from about -0.2°C to +0.4°C around 5,000 BC, followed by a decline to about -0.4°C in about 1650 AD. These changes appear as a smooth trend-line curve.
After 1800, human fossil fuel burning contributed a growing source of carbon, and after 1900, the temperature shoots up, breaking through this trend line. From a 12,000-year perspective, Earth’s temperature appears to rise almost straight up. This break through the historic range of variability (through the “upper Bollinger bands” of volatility in investment theory language) — is unprecedented in the Holocene.
5. Rate of Temperature Change
Like the CO2 increase, the rate of temperature increase is also unprecedented during the Holocene and even throughout the last 65 million years. During the fastest Holocene heating, as glaciers melted at the beginning of the era, temperatures rose 0.7°C over about 940 years, an average rate of about one-degree in 1,340 years. In the last 100 years, since 1919, Earth’s average temperature has risen 1.2°C, a rate of about 1°C every 83 years, over 16-times faster than the historically abrupt early Holocene heating. Until now, the Holocene had not witnessed a rate of temperature increase even close to our current rate.
,")
Holocene Earth temperature variations compared to historic average (1961-1990), showing modern spike that has broken through the trend lines. Graphic courtesy of NOAA, with data from S. Marcott, Science, 2013.
6. No Plateau yet
All earlier Holocene fluctuations plateaued and turned around in a repetitive fluctuation pattern. Denialists typically presume the modern temperature increase is over or nearly over. Some denialist sites even draw graphs showing the modern temperature line curving over into a plateau to simulate a typical Holocene anomaly. But no evidence indicates the modern Earth temperature increase is over, and latent heat energy inertia from human carbon emissions suggests the rise is not even remotely over. Thermodynamic theory predicts the increase will have to stop rising eventually, but the current steep rise without a plateau remains unprecedented in the Holocene.
7. The new forcings
Heat changes in a biophysical system require what physicists call energy “forcings,” measured in watts per square-meter (w/m2). Throughout Earth’s history, natural forcings that influenced Earth’s temperature included solar radiation; cloud cover; the reflective quality of land, water, or ice; and of course, the molecular components of the atmosphere. Throughout the industrial age humanity has added several new forcings: fuel waste carbon, methane, CFCs, nitrous-oxide, aerosols, and land use changes. The net human forcings (about 1.7 w/m2) is now the largest forcing effecting Earth’s climate. The growth of forests 300-million years ago produced a significant cooling effect, and the rise of land animals produced a warming effect, but during the Holocene, no single species has ever produced an energy forcing remotely on the scale of the human forcing.
8. Human influenced feedbacks
Heat can trigger tipping points that add more heat. Such “positive feedbacks” have always existed in natural systems, but human activity has augmented natural feedbacks and introduced new feedbacks. As oceans take up human carbon, they begin to reach a limit, and thus are less effective as carbon sinks. Human forest destruction has reduced forests as a carbon sink, leading to more heating. The scale of human fishing and disruption of nutrient cycles, leading to ocean dead zones. The full effect of these feedbacks remains uncertain, but tends toward increased heating. In the extreme, human forcings and feedbacks could lead to runaway heating and what physicists call a “state-shift” on Earth. These human-influenced feedbacks did not exist previously in the Holocene.

9. Global overshoot impacts
All successful species tend to grow beyond the sustainable limits of their habit. We can witness this in our own gardens. Evolution teaches species to consume, grow, and reproduce, but does not teach species to stop. Predators overshoot prey, algae overshoot lake nutrients, and humans are now the first animal in Earth’s history to overshoot the entire Earth. The Global Footprint Network calculates that humans overshot Earth’s capacity by 1970, about the time Greenpeace was founded, and now have overshot Earth’s carrying capacity by at least 75 percent.
“Existing overshoot estimates, scary as they may be, are under-estimates,” says William Rees, who wrote the Global Footprint model with Mathis Wackernagel. “Early on we were accused of exaggerating (we weren’t), so we designed the method to be conservative.” The effects of overshoot – depleted forests, acidic oceans, drained aquifers, atmospheric carbon, depleted soils, and so forth – have weakened Earth’s natural systemic ability to respond to heating. A single species overshoot at this scale has never before plagued Earth during its entire history, much less in the Holocene.
At current emission rates, our atmosphere will reach a doubling of atmospheric CO2 above pre-industrial concentrations by 2070. In 1896, Swedish chemist Svante Arrhenius calculated this would be enough to trigger a 4-5°C temperature increase. In 2013, 33 international scholars with the Palaeosens Project estimated in Nature that the doubling would cause a 2.2 – 4.8°C increase. A 2009 MIT study estimated a 90% chance of a 5.2°C increase by 2100.
Serious scientists know that we are attempting to predict the response of a complex system, and recognize the uncertainty in such systems. Denialists, on the other hand, use normal scientific uncertainty to sow doubt about the climate trends, their causes, or about the seriousness of human carbon emissions. None of this is particularly difficult for serious meteorologists. The fundamentals have been known for two centuries, and 65 years ago, even oil companies knew and published the fact that carbon emissions would heat the Earth. The alleged “climate debate” is an entirely manufactured public relations campaign by vested interests and their operatives, not science.
References and Links:
Daily CO2 readings: CO2 Earth
“Carbon Dioxide at Mauna Loa Observatory reaches new milestone: Tops 400 ppm,” Scripps, NOAA measurements cross threshold in same 24-hour period,” NOAA 2013.
Temperature Record Chart, 1000 to 2019, Temperaturerecord.org.
Modern CO2 surge: “Greenhouse Gas Bulletin,” 30 October, 2017, World Meteorological Organization, Atmospheric Environment Research Division; World Data Centre for Greenhouse Gases
Japan Meteorological Agency, Tokyo, Japan; “Trends in atmospheric carbon dioxide,” NOAA, The National Oceanic and Atmospheric Administration Earth System Research Laboratory, 2016; and Butler, J.H. and S.A. Montzka, “The NOAA annual greenhouse gas index (AGGI), NOAA, 2016.
“How the World Passed a Carbon Threshold and Why It Matters, Nicola Jones, Yale Environment 360 January 26, 2017.
“Arctic Is Thawing So Fast Scientists Are Losing Their Measuring Tools,” Dahr Jamail, Truthout, June 3, 2019.
Climate Sensitivity to doubling CO2 = 2.2 – 4.8°C:”Making sense of palaeoclimate sensitivity,” E. J. Rohling, A. Sluijs, H. A. Dijkstra, et al., Nature, v. 491, 2012, Palaeosens Project
CO2 reaching 550ppm, and temperatures at + 5.2°C by 2100: “Climate change odds much worse than thought,” David Chandler, MIT, 2009, review of study by Ronald Prinn, et al.
Modern Earth temperature data: NASA, Goddard Institute for Space Studies, Earth Sciences Division, Surface Temperature Analysis.
Global heating forcings: “Improved Attribution of Climate Forcing to Emissions,” Drew T. Shindell, Greg Faluvegi, Dorothy M. Koch, et. al., Science, v.326, 30 Oct 2009; and “Forcings in GISS Climate Models,” updated 2011, NASA, Goddard Institute for Space Studies, Earth Sciences Division.
Global heating physics: “A Tutorial on the Basic Physics of Climate Change,” American Physical Society, APS, 2008; and a simpler summary: The Physics of Global Warming, ScienceBlogs, 2010.
“Trends in Atmospheric Carbon Dioxide,” NOAA, Earth System Research Laboratory, Global Monitoring Division; a good source of data and graphs.
“History of Earth’s Climate 7, Cenozoic, Holocene,” a denialism’s attempt to dismiss anthropogenic global heating from CO2, a revealing tour of logical fallacies and pseudo-science, dandebat.
“Carbon Dioxide Emission-Intensity in Climate Projections: Comparing the Observational Record to Socio-Economic Scenarios.” Felix Pretis, Max Roser, Oxford University Dept. of Economics.
“No way out? The double-bind in seeking global prosperity alongside mitigated climate change,” T. J. Garrett, Univ. of Utah: Earth Systems Dynamics.
“Why we’re losing the battle to keep global warming below 2C,” The Guardian
“Target atmospheric CO2: Where should humanity aim? J. Hansen, M. Sato, P. Kharecha, et. al. (NASA, Columbia Univ., Univ. Sheffield, Yale Univ., LSCE/IPSL, Boston Univ., Wesleyan Univ., UC Santa Cruz): Cornell University Library.
“A reconstruction of regional and global temperature for the past 11,300 years,” Marcott, S.A., Shakun, J.D., Clark, P.U., Mix, A.C., Science, 339(6124), 1198-120, 2013.
“What’s the hottest Earth has been lately?”, Michon Scott, NOAA, 2014.
“Approaching a state shift in Earth’s biosphere,” Anthony D. Barnosky, Elizabeth A. Hadly, et al., Nature, 486, 2012.
Overshoot: “Tracking the ecological overshoot of the human economy,” Mathis Wackernagel, Niels B. Schulz, Diana Deumling, et al., Proceedings of the National Academy of Sciences (US), PNAS, 2002; graphic representation at Earth Overshoot Day; and William Rees in personal correspondence.