The conveniences of plastic have been touted for decades as indispensable. Although lightweight, cheap, and durable, what are the environmental consequences of this abundant material?
Rather than resolving the issue just by focusing on the plastic litter we see on our beaches, in landfills, in our communities, and in the ocean, there’s more to consider.
Nevertheless, in case you need more convincing, let me tell you why we must #BreakFreeFromPlastic now.
We’ve compiled 30 alarming facts about plastic that will make you rethink the use of this dangerous material.
#EndTheAgeOfPlastic: 30 Plastic FACTS
2023
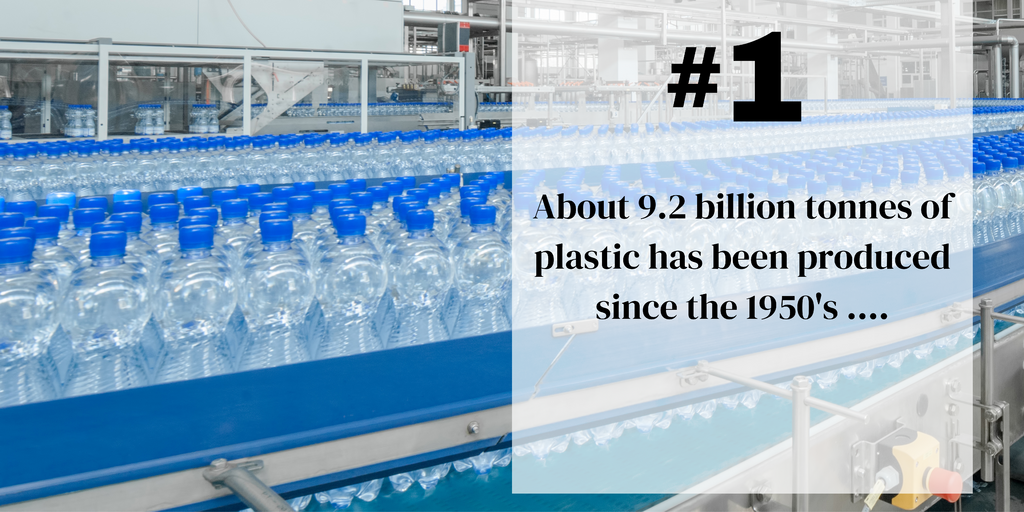
- About 9.2 billion tonnes of plastic has been produced since the 1950s – the weight of roughly 1.2 billion elephants or 88 million blue whales 1.
- In 2019, an estimated 368 million tonnes of plastic were produced globally 2.
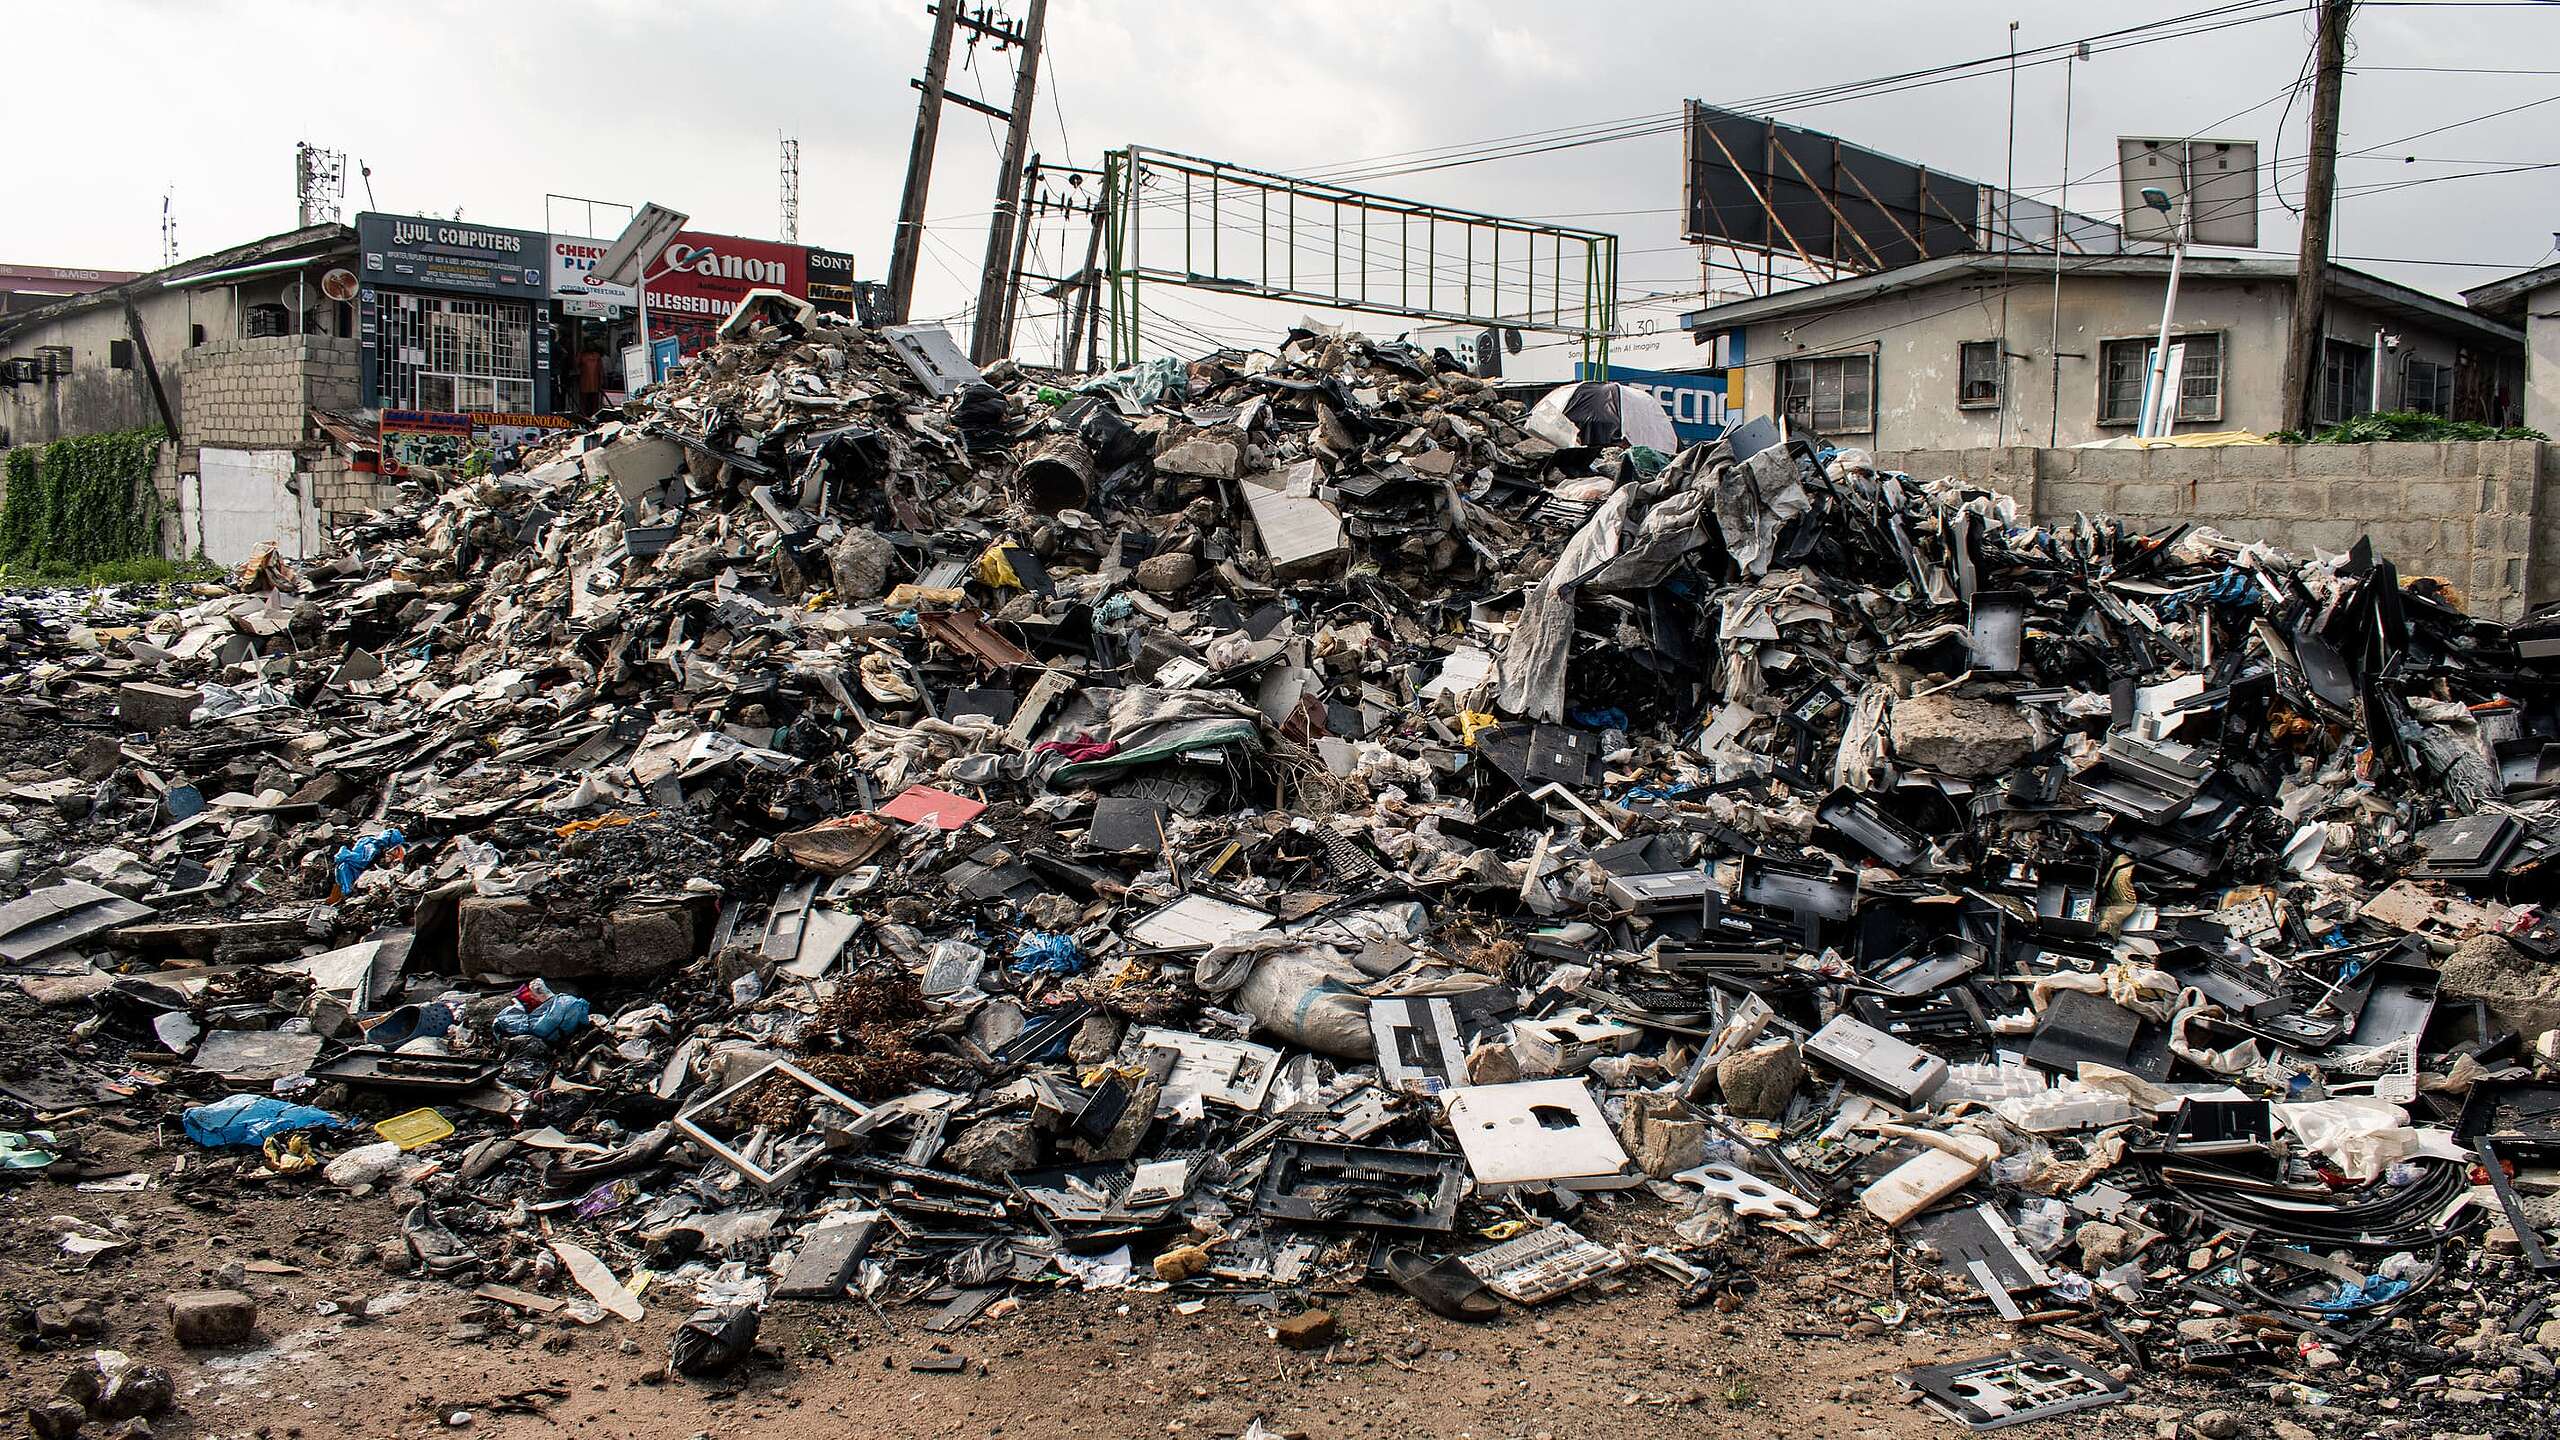
- Only 9% of all the plastic ever produced was recycled 3.
- 110 billion bottles are produced annually by Coca-Cola. In 2021, Coca-Cola produced 13 billion more plastic bottles than the previous year 4.
- The packaging industry is responsible for producing the highest amount of single-use plastic waste globally. About 36 percent of all plastic production is used for packaging purposes, including disposable food and beverage containers. Shockingly, 85 percent of these single-use plastics end up in landfills or as poorly managed waste.
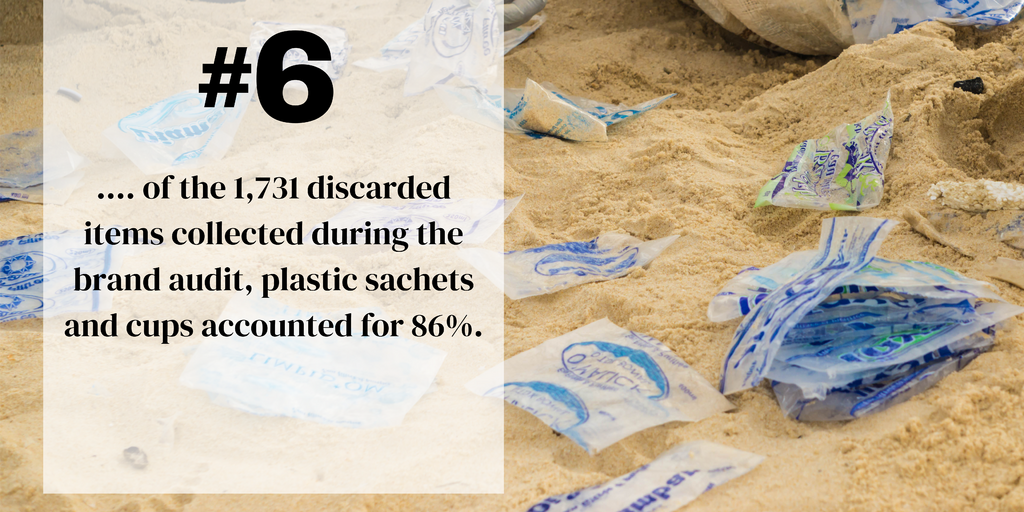
- From 2019 to 2020, local volunteers in Senegal conducted a series of brand audits, of the 1,731 discarded items collected during the brand audit, plastic sachets and cups accounted for 86%.
- More than 70 companies, including Coca-Cola, PepsiCo, Unilever, and Nestle, signed a statement in 2021 supporting a legally binding Global Plastics Treaty 5.
- In February 2022, Coca-Cola announced its commitment to package at least 25% of all beverages globally across its portfolio of brands in refillable/returnable glass or plastic bottles, or in refillable containers through a traditional fountain or Coca-Cola Freestyle dispensers 6.
- Plastic sachets are complex to recycle, they are made from multiple layers of plastic and sometimes with metal foil. Examples of these sachets include tea, coffee, soap, shampoo, and condiments like tomato sauce, mustard and soy sauce. They are made in smaller or single-serve portions.
- Half of all plastic packaging that is claimed to be recycled is actually exported. Mostly to countries with poor recycling infrastructure for supposed recycling with no transparency. As a result, plastic is far more likely to end up in open burning, landfills, incinerators or polluting the environment…7 8
- 6 Million metric tonnes (MMT) of waste was generated in 2021 compared to 2019 – and still almost entirely made from fossil fuel-based “virgin” feedstocks. 9
- In West Africa, marine plastic pollution results in damages estimated at around USD 10,000 to USD 33,000 per ton of plastic waste. The main sectors impacted include fisheries and aquaculture, marine-linked tourism, and biodiversity and ecosystems.
- More than 900 wild marine animal species have ingested marine debris or have become entangled with marine debris (predominantly plastic but also glass, rubber and metal). Note that this figure excludes organisms that do not move, such as corals 10
- 700 marine species including invertebrates, fish, birds, reptiles and mammals have been affected by marine debris. This includes entanglement, ingestion and smothering. 11
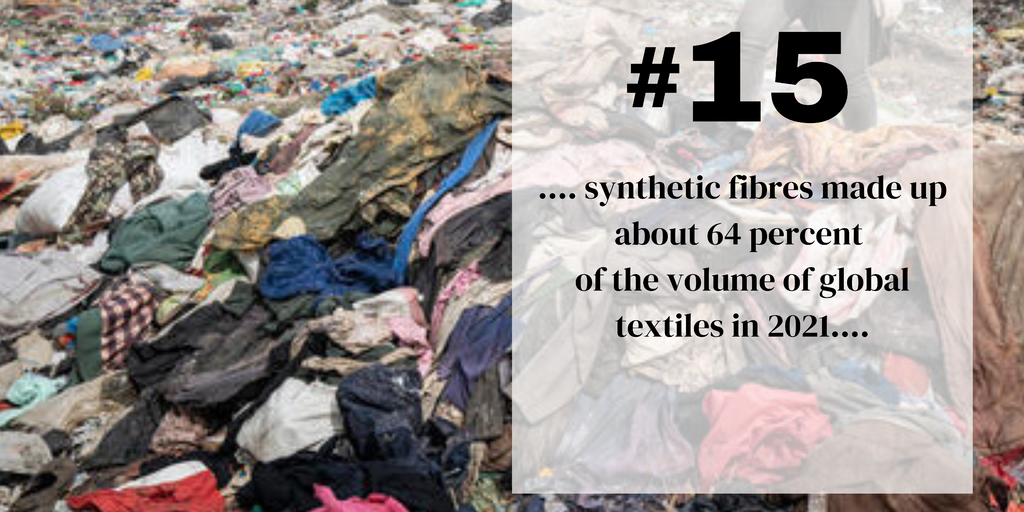
- The growth of fashion depends on fossil-fuel-based plastic fibres, mainly polyester: synthetic fibres made up about 64 percent of the volume of global textiles in 2021, and are projected to continue growing. 12
- In Ghana some 15 million used garments pour into the capital Accra every week, flooding the city’s clothing market. An estimated 40% are of such poor quality they are deemed worthless on arrival and end up dumped in a landfill. This means that about 6 million garments leave Kamanto Market every week as waste.15 (Citation Source – ABC news (2021), Dead white man’s clothes, 11th August 2021, updated 21st October 2021; https://www.abc.net.au/news/2021-08-12/fast-fashion-turning-parts-ghana-into-toxic-landfill/100358702)
- In Kenya, 185,000 tonnes of second-hand clothes were imported in 2019, 52 and according to Afrika collect textiles and other local sources, 30–40% of Mitumba is of such bad quality that it cannot be sold anymore. This means that 55,500 to 74,000 tonnes of it was actually textile waste. This amounts to about 150–200 tonnes of textile waste a day.
- Globally, 14–18% of plastic waste is mechanically recycled13, 24% is incinerated as energy recovery, and the remaining 58-62% is disposed of in landfills or dumped in the environment14. Recycling plastic simply delays the problem of plastic waste, it doesn’t solve it 15
- Living near facilities involved in oil and gas refining and drilling may make you more susceptible to a number of toxins from sources including: air pollution, diesel particulates and airborne volatile organic compounds. Unwanted noise from drilling and construction and traffic may also add to psychological stress 16.
- Burning plastic produces climate-impacting greenhouse gasses, and persistent pollutants (that can accumulate in land and marine food chains)17. Burning of plastics enables poorly designed products to continue being produced, wasting valuable resources that would be better reused.
- Plastic can take up to 1,000 years to break down, so when it is discarded, it builds up in the environment until it reaches a crisis point. This pollution chokes marine wildlife, damages soil and poisons groundwater, and can cause serious health impacts.
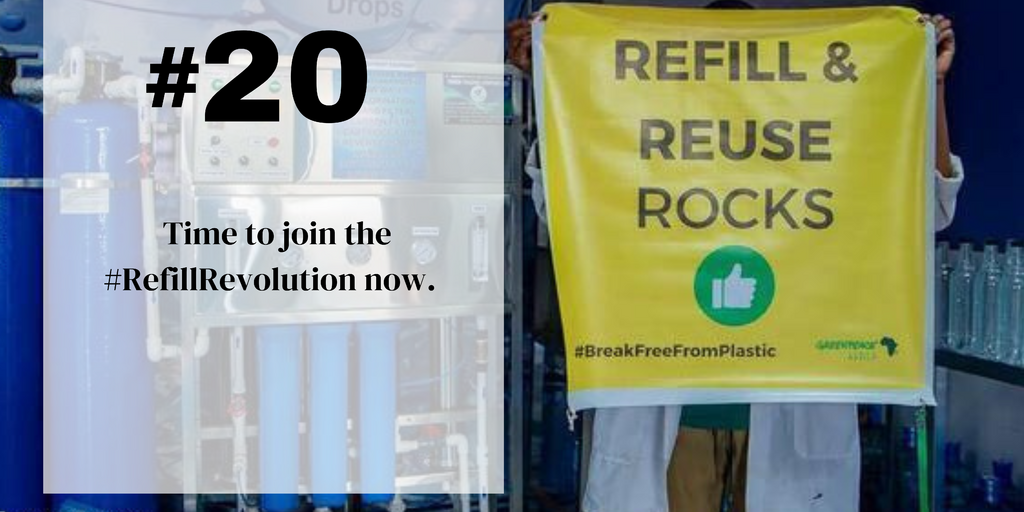
- Reuse and refill is becoming a growing movement from consumers across the globe. Time to join the #RefillRevolution now.
- More than 400 companies and 19 national, sub-national and local governments are introducing policy measures and commitments to reduce plastic waste and pollution18.
- If we were to replace even 20% of single-use packaging with reusables, it could be worth $10 billion in business opportunity,19 with other benefits beyond the reduced environmental and social impacts, including customer convenience and choice. This move will also create jobs. 20
- In some countries reuse systems are already in place: by 2018 reusable glass bottles were already accounting for 25% of the German mineral water market, with sales having grown 10% on the previous year. Additionally, the reuse share in the beer segment is at an astonishing 82%.22
- 34 African countries have either passed a law banning single-use plastic or passed a law with the intention of banning single-use plastics. Plastic bans in countries like Kenya and Rwanda have had tremendous impacts on safeguarding the environment.23
- South Africa, Egypt and Nigeria are some of the largest producers and importers of plastics in Africa. Between 1990 and 2017, 33 African countries imported approximately 86.14 Mt of polymers in primary form and 31.5 Mt of plastic products. This has led to Africa contributing significantly to the global plastic problem.
- The plastic bag legislation in South Africa was introduced in 2003 to reduce the demand for plastic bags. This did not change as the demand for plastic bags grew and it was evident that the policy failed partially. The plastic bag levy only succeeded at reducing consumption for the short term
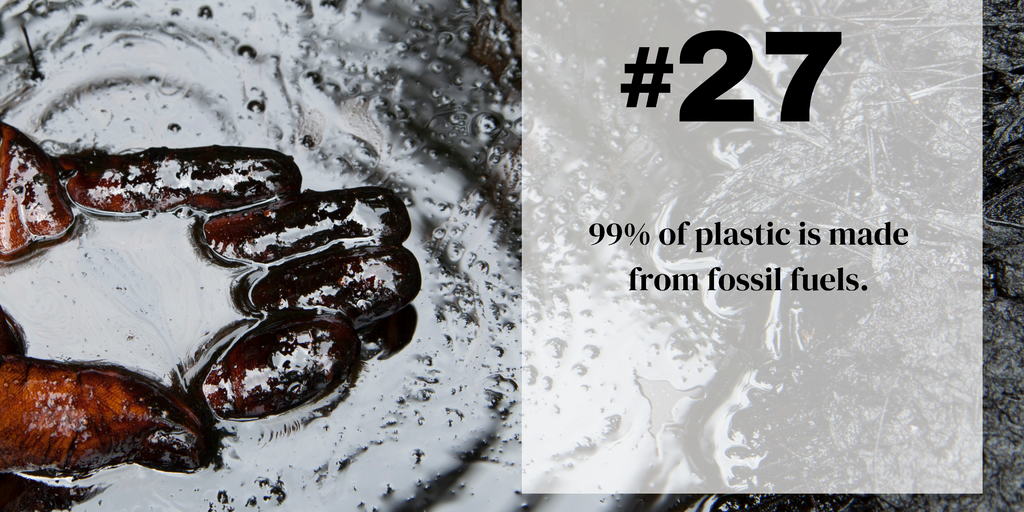
- 99% of plastic is made from fossil fuels. Plastic contributes to the climate crisis. Plastic production is also one of the most energy-intensive manufacturing processes.
- All over the world, marginalized communities face disproportionate health impacts from the plastics industry, whether through petrochemical facilities, incinerators, landfills, polluted waterways, or the burning of illegally imported plastic.
- Plastic production could double within the next 10-15* years, and triple by 2050, which is alarming, especially if we are to keep global warming below 1.5 degrees. (* compared to 2015) 3,4
- In 2019, plastics generated 1.8 billion metric tonnes of greenhouse gas emissions – equivalent to 189 coal-fired power plants – 3.4 percent of the global total
Natanya Harrington
Media Contacts: Greenpeace Africa Press Desk: [email protected]
Hellen Dena,
Communication and Story Manager,
[email protected], +254717104144
Sources – Compiled and listed here.
Other links to websites/blogs/articles as reflected in body.
1. Geyer, R. (2020). Chapter 2 in: Plastic Waste and Recycling, Letcher T M (Ed.), Academic Press, Cambridge, MA, USA (March 2020) Production, use, and fate of synthetic polymers
2. Plastics – The Facts 2020: An Analysis of European Plastics Production, Demand and Waste Data (Plastics Europe 2021).
3. Geyer, R., Jambeck, J. R. & Law, K. L. Production, use, and fate of all plastics ever made. Science Advances 3, e1700782. (2017). https://advances.sciencemag.org/content/3/7/e1700782
4. https://www.coca-colacompany.com/reports/business-environmental-social-governance-report-2021
5. https://www.plasticpollutiontreaty.org/unea
6. https://www.coca-colacompany.com/news/coca-cola-announces-industry-leading-target-for-reusable-packaging
7. Greenpeace. Trashed How The Uk Is Still Dumping Plastic Waste On The Rest Of The World. https://www.greenpeace.org.uk/wp-content/uploads/2021/05/Trashed-Greenpeace-plastics-report-final.pdf
8. https://www.recyclinginternational.com/recycling-news/8574/plastic-and-rubber/united-states/us-plastic-scrap-exports-jump-higher-2014]https://www.theguardian.com/environment/2018/jan/02/rubbish-already-building-up-at-uk-recycling-plants-due-to-china-import-ban
9. Plastic Waste Makers Index 2023. Minderoo Foundation. https://www.minderoo.org/plastic-waste-makers-index/#key-findings
10. Susanne Kühn, Jan Andries van Franeker, Quantitative overview of marine debris ingested by marine megafauna, Marine Pollution Bulletin, Volume 151, 2020, 110858, ISSN 0025-326X, https://doi.org/10.1016/j.marpolbul.2019.110858
11. Gall, S. and Thompson, R. ‘The impact of debris on marine life.’ Marine Pollut Bulletin. 2015 Mar 15;92(1-2):170-179. .https://doi.org/10.1016/j.marpolbul.2014.12.041; Kühn et al. (2015)
12. Statistica, Distribution of textile fibers production worldwide in 2021, by type; https://www.statista.com/statistics/1250812/global-fiber-production-share-type/ Synthetics are expected to grow, see Business Wire (2022), Global Synthetic Fiber Market Report 2022: Rising Adoption of Polyester Fiber & Expansion of the Textile Industry Drive Growth, 22nd September 2022; https://www.businesswire.com/news/home/20220922005495/en/Global-Synthetic-Fiber-Market-Report-2022-Rising-Adoption-of-Polyester-Fiber-Expansion-of-the-Textile-Industry-Drive-Growth—ResearchAndMarkets.com
13. https://www.oecd.org/environment/waste/policy-highlights-improving-plastics-management.pdf
14. Geyer, R., Jambeck, J. R. & Law, K. L. Production, use, and fate of all plastics ever made. Science Advances 3, e1700782. (2017). https://advances.sciencemag.org/content/3/7/e1700782
15. Geyer, R., Jambeck, J. R. & Law, K. L. Production, use, and fate of all plastics ever made. Science Advances 3, e1700782. (2017). https://advances.sciencemag.org/content/3/7/e1700782
16. Richburg, C.M. & Slagley, J. Public Health Nurs. 36, 3–10 (2019). DOI: 10.1111/phn.12540
17. Kaza, S., Yao, L., Bhada-Tata, P. & Van Woerden, F. What a Waste 2.0: A Global Snapshot of Solid Waste Management to 2050 World Bank Publications (2018) License: CC BY 3.0 IGO
18. https://www.weforum.org/reports/future-of-reusable-consumption-models
19. Ellen MacArthur Foundation (2019), ‘Reuse’; https://www.ellenmacarthurfoundation.org/assets/downloads/Reuse.pdf
20. Ellen MacArthur Foundation (2019), ‘Reuse’; https://www.ellenmacarthurfoundation.org/assets/downloads/Reuse.pdf
21. https://blog.drinktec.com/cross-industry/beaded-glass-bottle-reaches-50-reusable-glass-bottle-makes-its-comeback/
22. https://www.duh.de/fileadmin/user_upload/download/Projektinformation/Kreislaufwirtschaft/Mehrweg_Hintergrundpapier_2015.pdf
23. https://www.greenpeace.org/africa/en/blogs/11156/34-plastic-bans-in-africa/#comments
24. See, for example: Allshouse et al. Environ Sci Technol. 53, 7126–7135 (2019). DOI: 10.1021/acs.est.9b00052; Johnston et al. Sci Total Environ. 657, 187–99 (2019) DOI: 10.1016/j.scitotenv.2018.11.483.
25. https://www.ciel.org/plasticandclimate/